Dashboards contain a collection of tiles (also known as tabs or folders) in order to present different categories of information to users when they login. The following are the different types of tiles which can be featured:

Quick note
Allows the user to type in a note and save this to their timeline. When saved it will appear on their timeline titled quick draft. From there it is possible for the note to be turned into an event. The note text that was originally saved will be shown within the event description which the user can either keep there or copy/paste into other fields in the event.
To do list
This is capable of displaying the user's to do list and/or their saved drafts. The saved drafts will be anything they have manually saved or autosaves.
Create a new event
This allows the user quick access to create a new event or form for either themselves or another user. Dependent on their permissions they will see the option that is applicable to them.
Inbox
Displays all announcements applicable to the user. They can be viewed in full by clicking directly on the title which also then marks it as ‘read’. Dismissed announcements are saved in their archive until the date of expiration is reached.
KaizenHQ
Provides a link to our customer hub where information on our development process can be found.
Text
Allows entry and formatting of free text. It is also possible to paste URLs from YouTube or Vimeo to automatically embed videos into this tile.
Goal set details
A goal set is the collection of goals created within one event. This tile allows you to show just one goal set so that the user can see a very specific list of goals that all relate to the same thing.
An overview of all your goals
Shows all of the active goals for the user. Active goals are those which have not yet been closed.
Blueprint coverage
Shows an overview of how much of a blueprint the user has tagged to. If the blueprint(s) has been restricted within a relation then they will be categorised as current, previous or future and be titled with the blueprint element to which they were restricted to.
Report
Allows you to feature the output of a report. When adding this tile you can select from any of the published report templates in the system and can select whether to display the output table, chart or both together. The user will need to have been given visibility of the report in order to be able to view it here.
My connections
Shows a list of other users that the person viewing this tile can see. The settings for this tile allows you to choose which role(s) the person viewing the tile must have in order to display subsets of users.
Profile
Shows all of the profile information for that user: full name, user fields, relations (current, previous, future), roles.
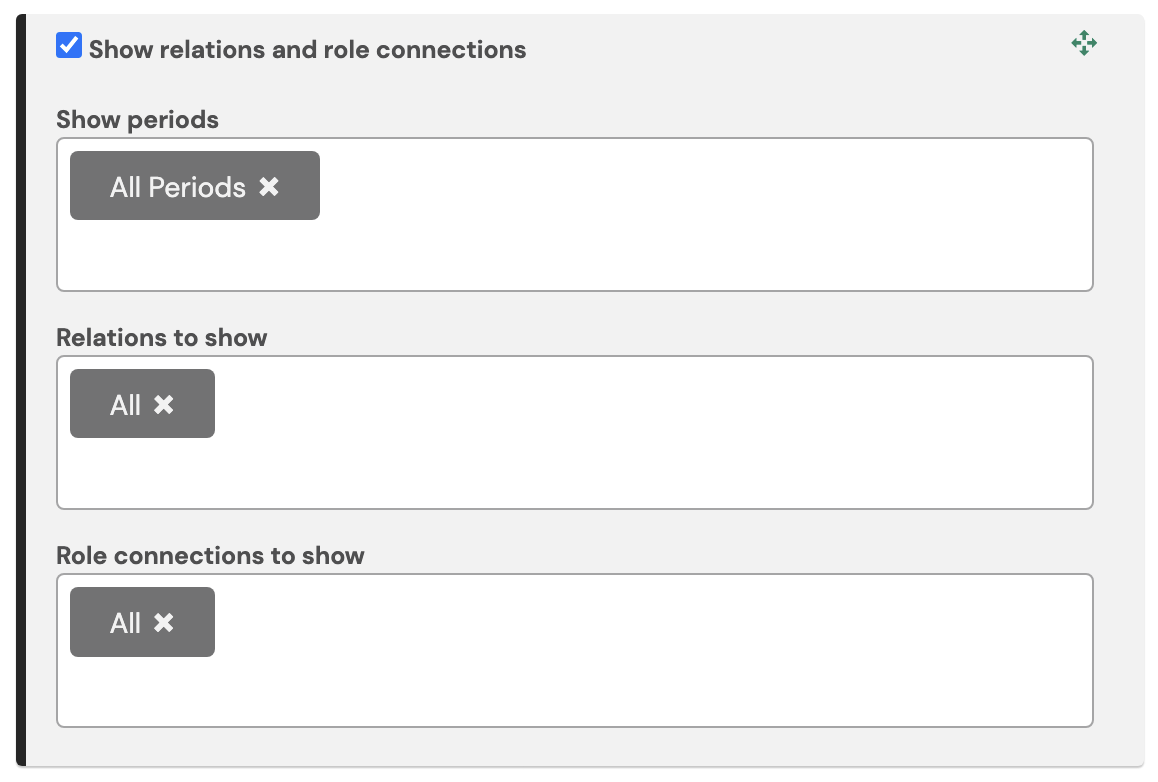
The profile tile allows for the display of the profile information of the user. The settings of the tile can be customised to show different types of information. Show relations and role connections Show periods | Allows for selection between Current, Previous and Future information to be displayed | Relations to show | Allows for selection of which relations to display. If multiple relations are selected, the order in which they are displayed is determined by the ordering settings within the relations list. | Role connections to show | Allows for selection of any roles which have been set as role dependent connections |
 Creating multiple profile tiles enables the separation of different allocations of a user’s relation information.  |

