Blueprints are created centrally and can then be featured directly on events. It is recommended to use blueprints for data that should be considered to be exactly the same across the system in order to easily pull that data out into reports later.
...
Blueprints are located within the content area of the application
That will take you to a list of your existing blueprints. There is no publishing workflow so once created and saved each blueprint is immediately ready to be added to your events. To create a new one click the green new blueprint button at the top of the page.

You are then taken to the edit screen where you are able to specify the name and type of blueprint you wish to create.
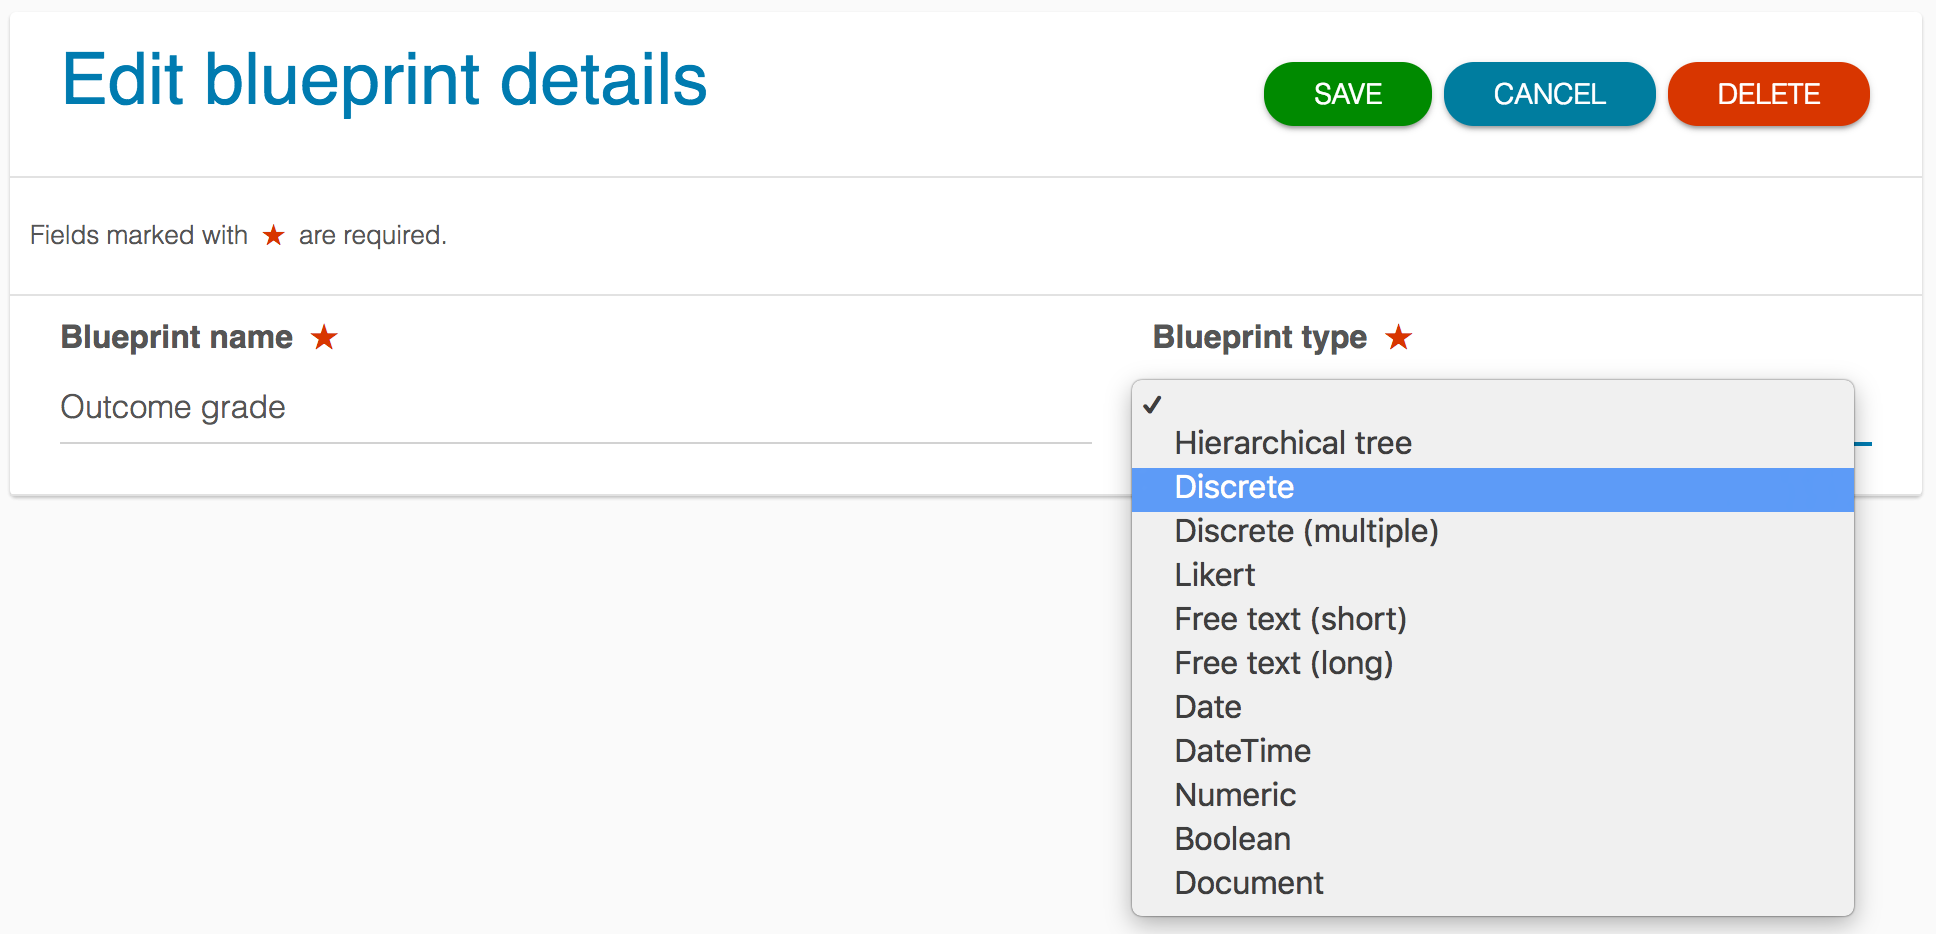
Selecting either hierarchical tree, discrete or discrete likert as blueprint type will provide the option to enter in that dataset.
Discrete blueprints will display in the browser as a drop down list.
Likert blueprints also display in the browser as a drop down list but please be aware . This option includes the ability to assign numeric values to blueprint categories. Reporting calculations can then be made using the associated numeric value to that option (SUM, AVG etc).
Note that browsers only have the capability of displaying drop downs that have a maximum of two levels. If you create more than two levels for a discrete or likert blueprint it will be displayed in the same manner as the hierarchical tree to ensure browser compatibility.For In this example, we will create a dataset which will be presented as a simple dropdown when featured on an event and so select discrete. To create the options which will appear in this dropdown start by clicking the blue add new category button.

Then enter the name of your top level category. To create further top level categories continue clicking the blue add new category button.
To create options underneath a top level click the + icon to create a nested category

There are then options for any further usage of this blueprint under the setting select any additional purpose for this blueprint.
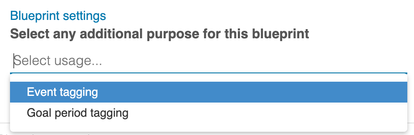

Event tagging - makes this blueprint available to users when they are tagging their events
Goal period tagging - allows you to use this blueprint to tag to goal periodsIf you wish to limit the only certain values within this blueprint from being visible to your users then ensure you choose to enable the setting would you like to restrict this blueprint by relations? You will also need to ensure you have added this blueprint to those relations to which you wish to display.
When you have finished providing all the options you wish to feature in this blueprint click the green save button at the top of the page.


| Info |
|---|
Blueprints are often designed with different usage applications in mind. Often they are mainly for internal use, such as the example of the outcome grade which will be featured on an event. Other times they may be designed to give to end users so that they can tag their events from options that you provide to them. A good example of this use case is a curriculum. |
...